Observed evidence
Battery savings for Smartwatch S2 were offset by higher casing and vibration-motor prices. Two-month matching shows some same-direction changes, but incomplete comparable BOM coverage prevents a pass-through-rate conclusion.
Project 03 / Sourcing Cost Reduction & Management BI
Review annual savings from accepted goods receipts and trace component price changes through the BOM.
Simulated transactions · 2025 review
Method: compare current accepted quantities against the prior-year quantity-weighted price for the same model or component. Values are untaxed CNY; rejected quantities are excluded. The finished-product annual target is 5%.
View the saved report previews directly; select an image to enlarge it. Expand the Power BI report when you need interactive filters.
01 / Finished-product savings review
2025 comparable savings were −24,695.74 CNY, a −2.22% savings rate, with 86.79% of receipt value comparable. TWS Pro and Smartwatch S2 account for approximately 80% of the net cost increase.
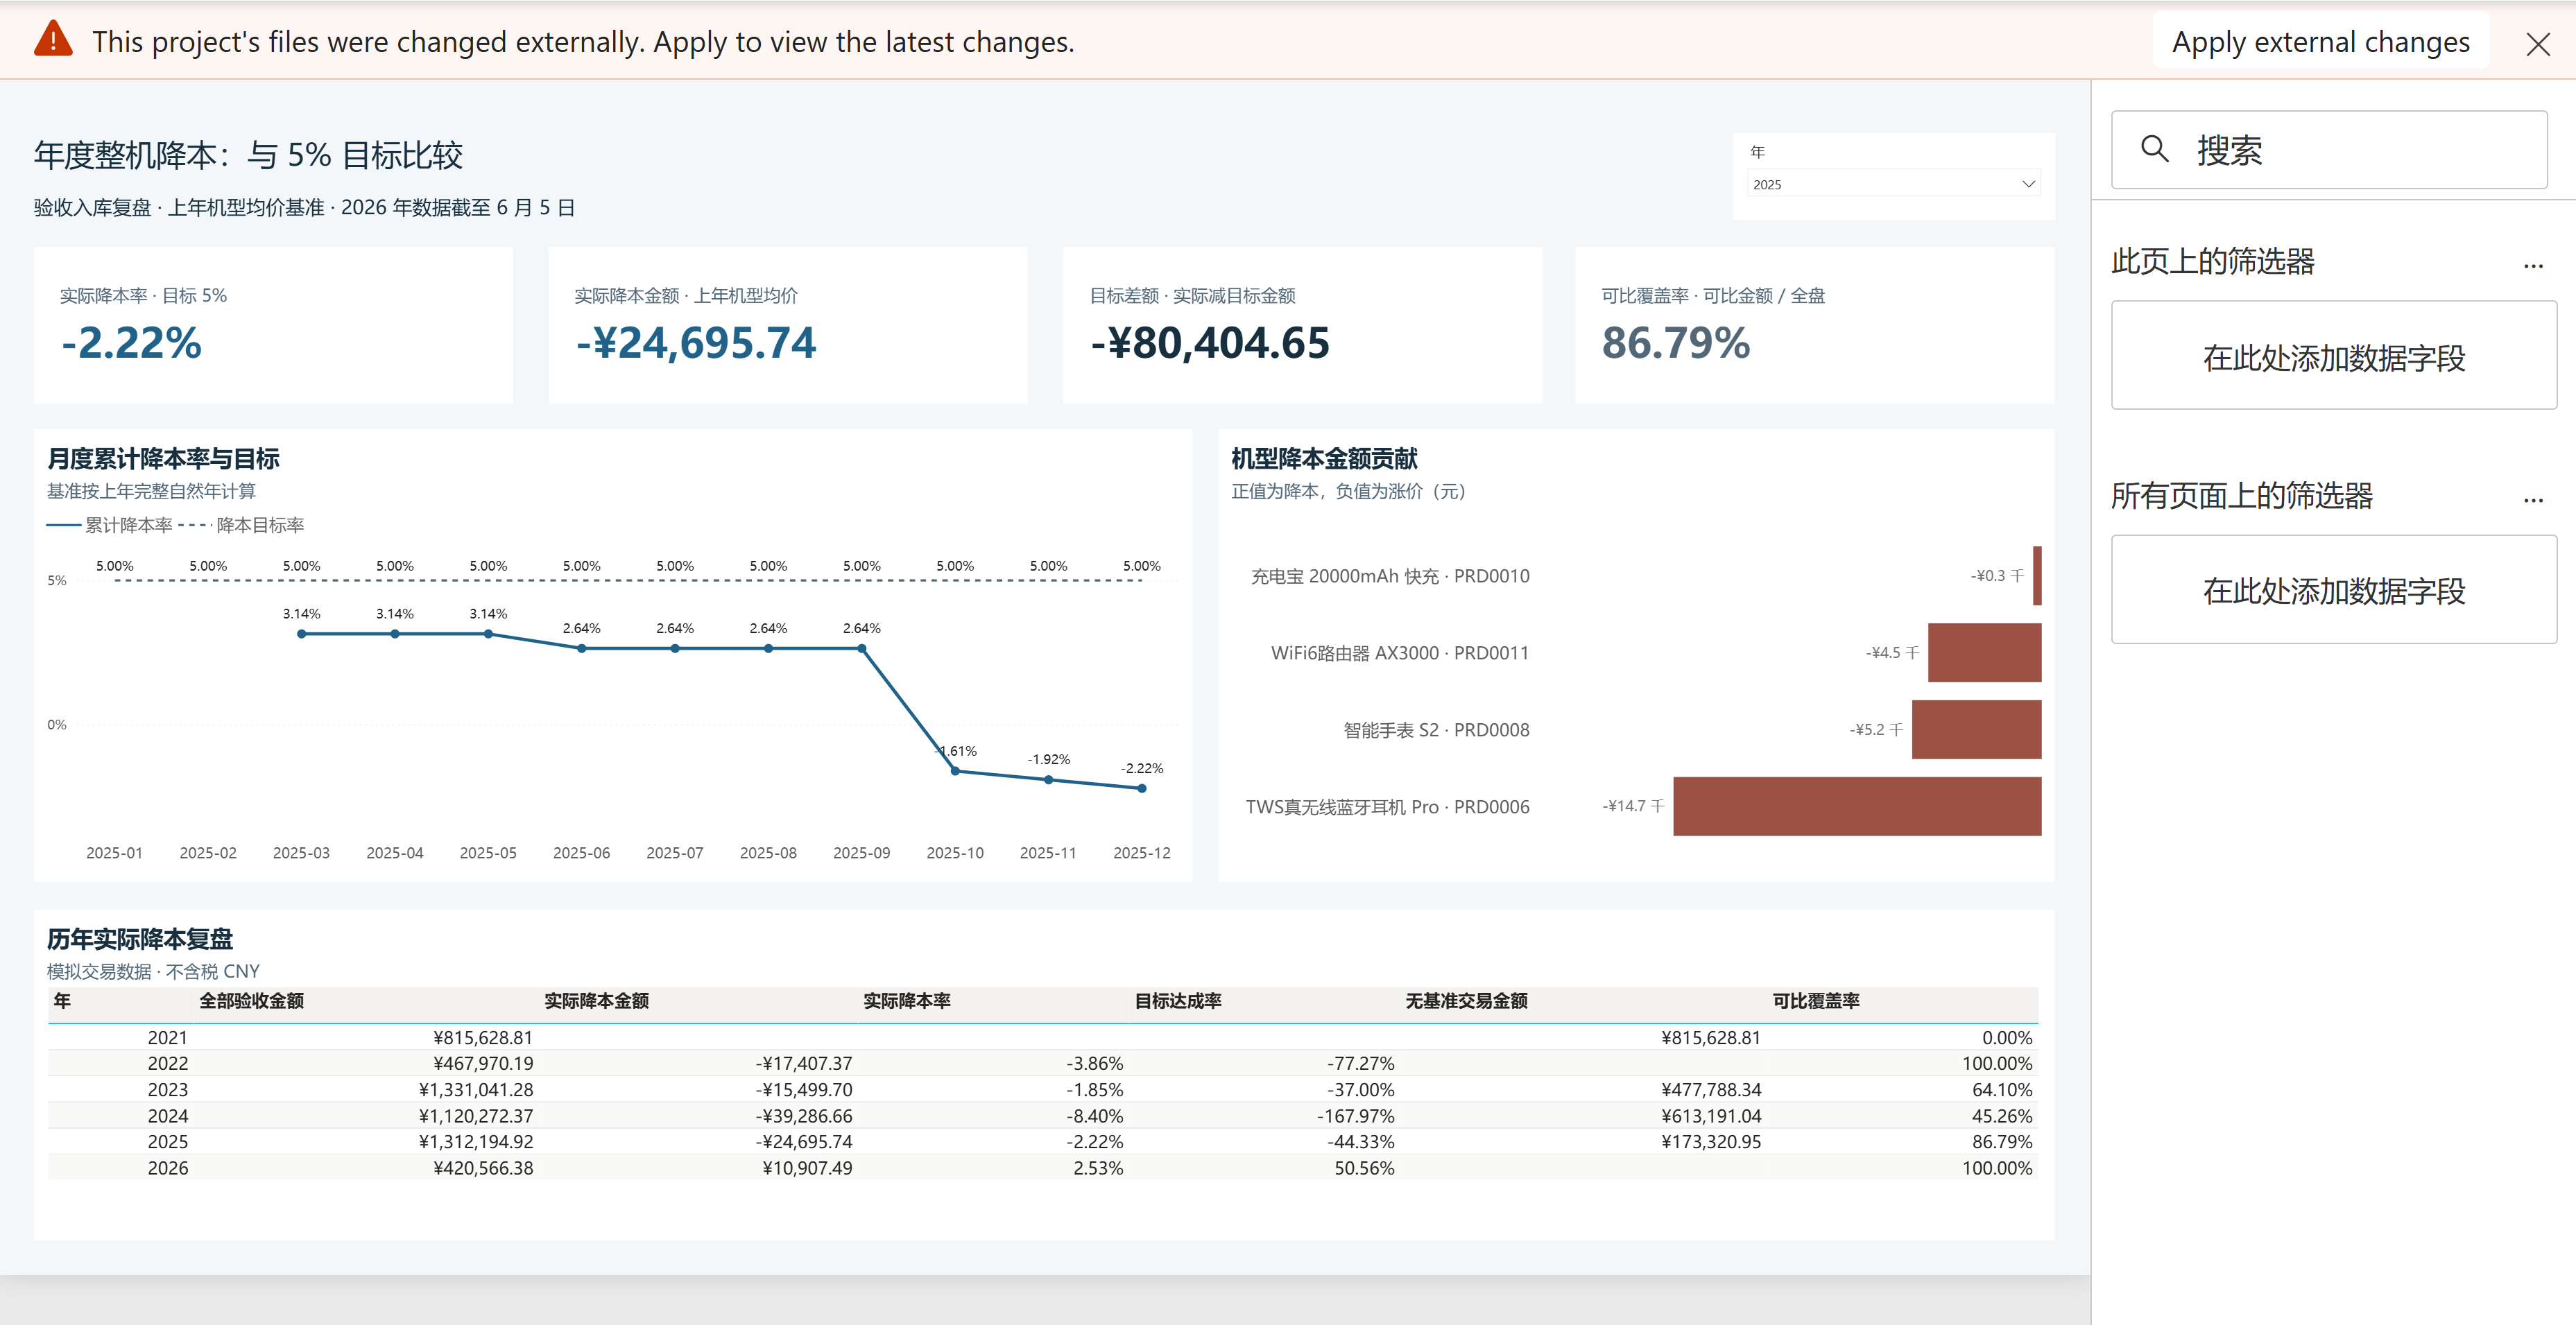
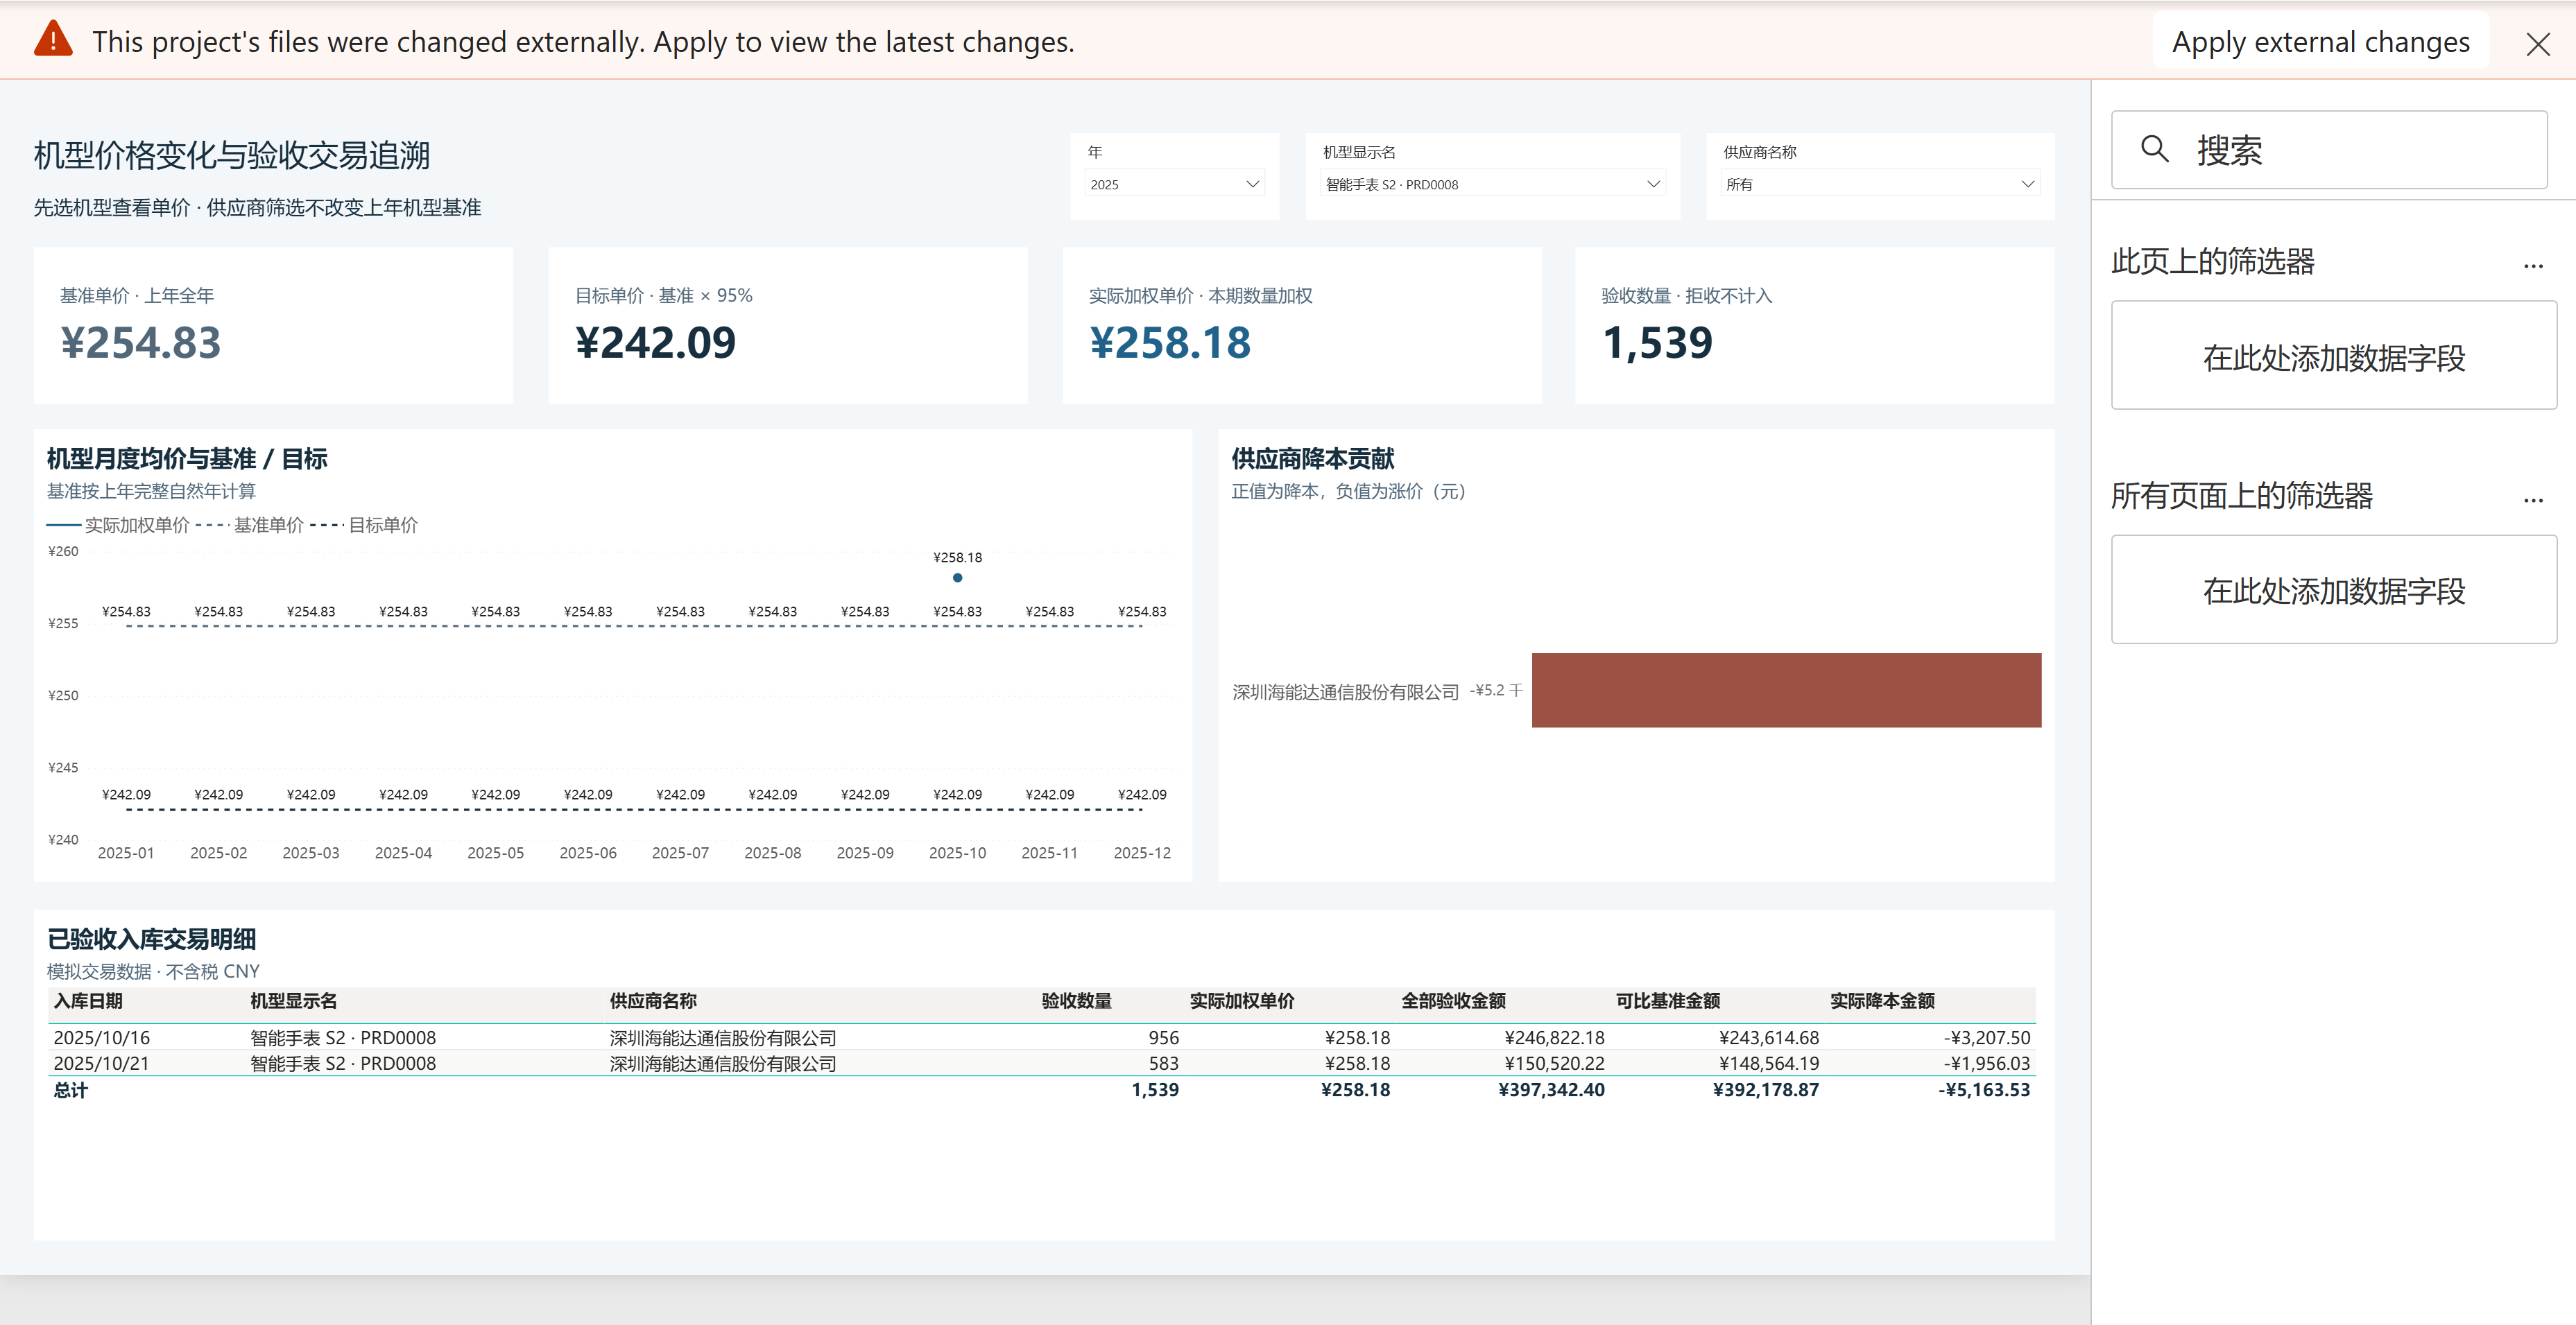
Use the report filters and bottom page tabs to switch between the annual review and model details. Open report in a new window
02 / Component savings review
Trace each component to its model and parent component to group price changes by BOM module. Comparable 2025 savings for level-2 and level-3 components were −14,892.08 CNY, a −1.00% rate, with 14.58% comparable value coverage.
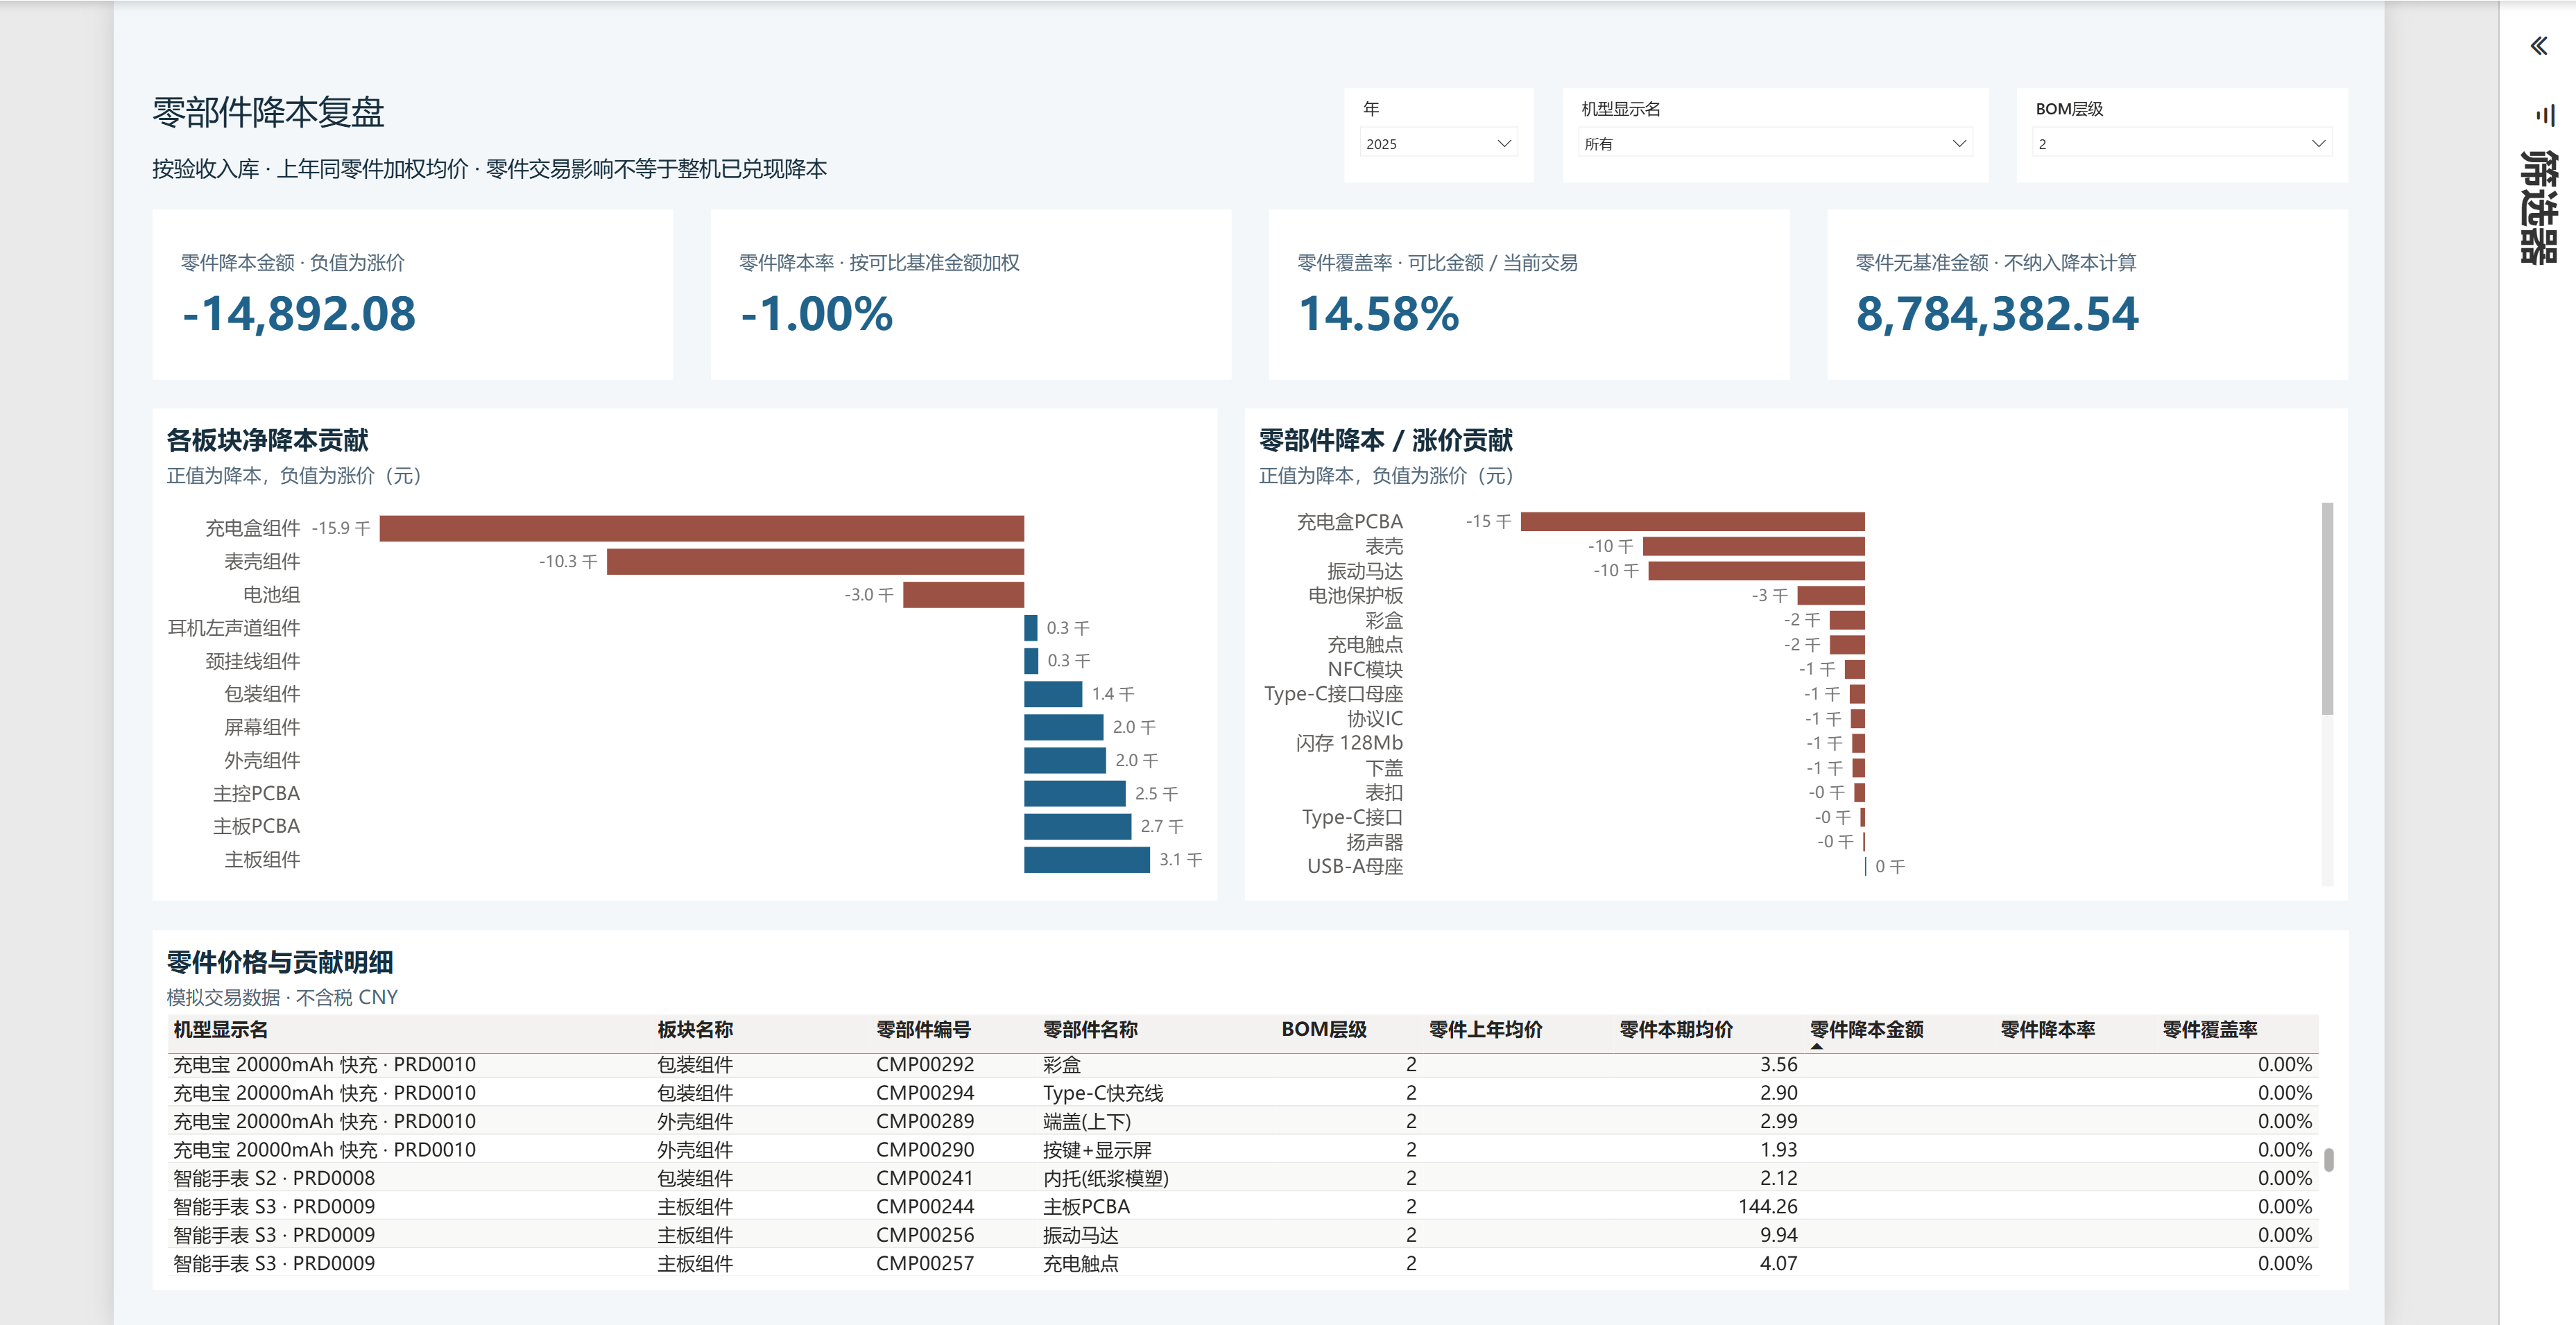
Components without a prior-year baseline remain blank and their value is reported separately. Component and finished-product transaction savings cannot be added. Parent assemblies and their children must not both count toward per-unit BOM cost.
03 / Combined procurement cost review
A five-slide review covering overall results, priority models, offsetting component changes, the two-month pass-through hypothesis and the evidence needed to investigate causes.
Battery savings for Smartwatch S2 were offset by higher casing and vibration-motor prices. Two-month matching shows some same-direction changes, but incomplete comparable BOM coverage prevents a pass-through-rate conclusion.
Like-for-like purchase price changes, supplier mix, old inventory consumption, material usage or scrap, and manufacturing fees. Validate these using contracts, issue batches and subcontracting settlements.